Wednesday, October 27, 2010
Isotopes and Atoms
Hello fellow follower of this blog, would like to thank for the follow and enjoy more of chemistry 11 (:
This is about the atom and its different forms also called isotopes.
Let us cool it down with the basics, let's talk about the atomic number.
The atomic number is basically the number of protons within an atom
You can obtain the number of neutrons by following this equation:
Atomic mass - Atomic number = Number of Protons
(p+n) - (p) = (n)
 ISOTOPES!
This is KEY to your success in your understanding of isotopes
What is an isotope in the first place!?
Well calm down, its simple.
An isotope has the same traits as an atom, with the same atomic number an all, but the secret on isotopes are that the mass between isotopes of the same element are different.
Just to clear the contradicting of "same" and "different" in the last sentence,
NOT ALL ATOMS of the SAME ELEMENT are IDENTICAL!!!
Some cool instruments are used to determine the abundance and mass of the isotopes of the elements
these are called Mass Spectrometers!
Above this, is a video of a mass spectrometer in action! Since we are in a filipino majority school, its a demo from straight from the Philippines!!! Enjoy (:
This is about the atom and its different forms also called isotopes.
Let us cool it down with the basics, let's talk about the atomic number.
The atomic number is basically the number of protons within an atom
You can obtain the number of neutrons by following this equation:
Atomic mass - Atomic number = Number of Protons
(p+n) - (p) = (n)

This is KEY to your success in your understanding of isotopes
What is an isotope in the first place!?
Well calm down, its simple.
An isotope has the same traits as an atom, with the same atomic number an all, but the secret on isotopes are that the mass between isotopes of the same element are different.
Just to clear the contradicting of "same" and "different" in the last sentence,
NOT ALL ATOMS of the SAME ELEMENT are IDENTICAL!!!
Some cool instruments are used to determine the abundance and mass of the isotopes of the elements
these are called Mass Spectrometers!
Above this, is a video of a mass spectrometer in action! Since we are in a filipino majority school, its a demo from straight from the Philippines!!! Enjoy (:
Tuesday, October 26, 2010
VIDEO FOR YOU YOUNG CHEMISTS!! : http://www.youtube.com/watch?
v=rSZrZWXxxgQ
A.Bohr model diagrams: 1. Rutherford's model was inherently unstable
2. Matter emits light when it's heated [ blackbody radiation ]
3. Lights travels as photons
4. The energy photons carry depends on their wavelength
5. Bohr based his model on the energy [ light ] emitted by different atoms
6. Each atom has a specific spectra of light
7. To explain this emission spectra Bohr suggested that electrons occupy
shells or orbitals

B. Bohr's Theory: 1. Electrons exit in orbitals
2. When they absorb energy they move to a higher orbital
3. As they fall from a higher orbital to a lower one they release energy as
a photon of light
SORRY FOR THE LATE POST KIDS, BUT STAY TUNED FOR WHAT'S COMING UP!!!
v=rSZrZWXxxgQ
A.Bohr model diagrams: 1. Rutherford's model was inherently unstable
2. Matter emits light when it's heated [ blackbody radiation ]
3. Lights travels as photons
4. The energy photons carry depends on their wavelength
5. Bohr based his model on the energy [ light ] emitted by different atoms
6. Each atom has a specific spectra of light
7. To explain this emission spectra Bohr suggested that electrons occupy
shells or orbitals
B. Bohr's Theory: 1. Electrons exit in orbitals
2. When they absorb energy they move to a higher orbital
3. As they fall from a higher orbital to a lower one they release energy as
a photon of light
SORRY FOR THE LATE POST KIDS, BUT STAY TUNED FOR WHAT'S COMING UP!!!
Monday, October 25, 2010
Quantum Mechanics
Bohr's Theory & Model
In order to fully understand Quantum Mechanics, we must also have a grasp on the Bohr Theory and Model as they serve as the foundation.
Some of the main points one most know for the Bohr Theory & Model are:
1) Electrons exist in orbitals
-> orbitals are found on energy levels/shells
-> there are 2 electrons in the first orbital
-> there are 8 electrons in the second orbital (called an octet when full)
-> there are 8 electrons in the third orbital (called an octet when full)
-> there are 18 electrons in the fourth orbital, etc.
2) When electrons absorb energy, they move to a higher orbital
3) As electrons fall from a higher orbital to a lower one, they release energy as a photon of light
4) The Bohr Theory can be represented as either an Energy Level Model or the regular Bohr Model


EXAMPLE: The picture shown above are Bohr Models. Instead of colored dots, the neutrons & protons may be expressed with a number and their sign (p for protons & n for neutrons).
Quantum Theory
The main points of the Quantum Theory are:
1) An electron is like a cloud of negative energy or a wave
2) Orbitals are areas in 3D space where electrons probably are
3) The energy of an electron is in its vibrational modes (ie: the notes played on a guitar string)
4) photons are produced when high energy modes change to lower energy modes
On each energy level, there are Orbitals:
S-Orbitals
-each orbital holds 2 electrons

P-Orbitals
-there are 3 sub orbitals that contain 2 electrons each (6 electrons in total)

D-Orbitals
-there are 5 sub orbitals that contain 2 electrons each (10 electrons in total)

F-Orbitals
-there are 7 sub orbitals that contain 2 electrons each (14 electrons in total)

Diagram To Help Explain Orbitals:
 Consider the hotel above an atom. Each level in the hotel represents an energy level in the atom. Each floor on a level (distinguished by S,P,D,& F) represent the orbitals (distinguished by S,P,D, & F). On each floor there are rooms which represent the number of sub orbitals. The people standing in each room represent the number of electrons that exist in that orbital. Since the people have the ability to move around their levels, they don't have a fixed place but rather, a general area that they take up. In this sense, electrons are similar as they are thought of to be clouds of negative energy occupying a general area on their level.
In order to fully understand Quantum Mechanics, we must also have a grasp on the Bohr Theory and Model as they serve as the foundation.
Some of the main points one most know for the Bohr Theory & Model are:
1) Electrons exist in orbitals
-> orbitals are found on energy levels/shells
-> there are 2 electrons in the first orbital
-> there are 8 electrons in the second orbital (called an octet when full)
-> there are 8 electrons in the third orbital (called an octet when full)
-> there are 18 electrons in the fourth orbital, etc.
2) When electrons absorb energy, they move to a higher orbital
3) As electrons fall from a higher orbital to a lower one, they release energy as a photon of light
4) The Bohr Theory can be represented as either an Energy Level Model or the regular Bohr Model

EXAMPLE: The diagram shown above is an Energy Level Model of the atom Krypton (Kr). Instead of drawing individual dots, one can just write out the number of electrons that are to be found on each level and the number of protons and neutrons found in the nucleus.

Quantum Theory
The main points of the Quantum Theory are:
1) An electron is like a cloud of negative energy or a wave
2) Orbitals are areas in 3D space where electrons probably are
3) The energy of an electron is in its vibrational modes (ie: the notes played on a guitar string)
4) photons are produced when high energy modes change to lower energy modes
On each energy level, there are Orbitals:
S-Orbitals
-each orbital holds 2 electrons
P-Orbitals
-there are 3 sub orbitals that contain 2 electrons each (6 electrons in total)
D-Orbitals
-there are 5 sub orbitals that contain 2 electrons each (10 electrons in total)
-there are 7 sub orbitals that contain 2 electrons each (14 electrons in total)

Diagram To Help Explain Orbitals:

*Credits:
->Bohr Diagrams:
http://lapse.nerdvana.org.au/comedy/pics/atom-bohr.gif
->S-Orbital:
http://img.sparknotes.com/figures/0/083ee1e849c82204c3d7c342d336a448/sorbital.gif
->P-Orbital:
http://img.sparknotes.com/figures/5/5578bdf1aec90e46e14325a580fdbf6a/porbital.gif
->D-Orbital:
http://img.sparknotes.com/figures/5/5578bdf1aec90e46e14325a580fdbf6a/dorbital.gif
->F-Orbital:
http://www.chemistry.ucsc.edu/~soliver/151A/Handouts/f-orbitals.gif
->Stick Figure:
http://3.bp.blogspot.com/_V5zRBX0DFfE/SaCpyJ6APBI/AAAAAAAAAGI/u0N19lXNlYs/s320/stick_figure.gif
Wednesday, October 20, 2010
Bohr continued...
Bohr Model
-Atoms are electrically neutral.
-Two different models can be used to describe electron configuration.
-Electrons occupy shells which are divided into orbitals.
2e- in the first orbital
8e- in the second orbital
8e- in the third orbital
14e- in the fourth orbital
http://www.youtube.com/watch?v=FFCTiwJewz4
Monday, October 4, 2010
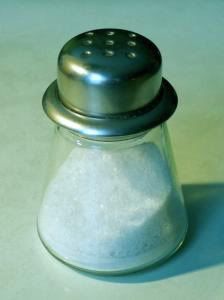
H2O (or dihydrogen monoxide haha) Solubility of Sodium Chloride
Hello Followers of this blog (: Today we had our first ever lab testing the solubility of water when mixed with Sodium Chloride, easily found in your normal table salt.
 So there was certain procedures that we did to measure the solubility of the water with Salt
1) Get items for the lab (graduated cylinder, scoopula, beaker, wax paper, table salt, stirring rod, scale)
2) Get the safety equipment! (even though we are dealing with salt, Mr. Doktor will Zerg rush you guys on Starcraft II if you don't....so "MAKE IT A HABIT" - Mr. Doktor)
3)Measure 10,20,40,50 mL of water with your GRADUATED CYLINDER, because using a beaker is inaccurate.
4) Then pour it in the beaker
5) Put table salt on the wax paper which is on the scale
6) Zero in the scale to make life easier.
7) Then keep on pouring salt in the water with the scoopula and keep on pouring salt until the water is soluble, which means it will show some salt crystals on the bottom of the beaker.
8) Finally record on the table, because you will forget.
FACT
Salt (NaCl) is an ionic compound used as a condiment, and also (it was a shock to me but did make sense due to taking the water out of things) as a preservative!
Friday, October 1, 2010
Density & Graphing
Density
The density of an object can be expressed through the equation:

EXAMPLE: WATER AS A LIQUID HAS IT'S GREATEST DENSITY OF APPROXIMATELY 1000 KG/M³ AT 4˚C AND EVENTUALLY BECOMES LESS DENSE AS THE TEMPERATURE DROPS TO 0˚C. THEREFORE, ICE, HAVING A LOWER TEMPERATURE THAN IT'S LIQUID STATE, WOULD BE LESS DENSE CAUSING IT TO FLOAT ON LIQUID WATER.
VIDEO EXAMPLE: http://www.youtube.com/watch?v=rxb_6UANXqU
 EXAMPLE: THE GRAPH SHOWN ABOVE SHOWS THE RELATION BETWEEN THE NUMBER OF WORDS ONE CAN TYPE PER MINUTE BASED ON THE WEEKS OF PRACTICE ONE HAS.
The density of an object can be expressed through the equation:
d=m/v
Where the 'd' is the density and is found by dividing the mass of an object (m) with it's volume (v).
Density is usually expressed by the units kg/L, kg/m³, or g/cm³.

EXAMPLE: WATER AS A LIQUID HAS IT'S GREATEST DENSITY OF APPROXIMATELY 1000 KG/M³ AT 4˚C AND EVENTUALLY BECOMES LESS DENSE AS THE TEMPERATURE DROPS TO 0˚C. THEREFORE, ICE, HAVING A LOWER TEMPERATURE THAN IT'S LIQUID STATE, WOULD BE LESS DENSE CAUSING IT TO FLOAT ON LIQUID WATER.
VIDEO EXAMPLE: http://www.youtube.com/watch?v=rxb_6UANXqU
Graphing
All graphs must contain 5 aspects:
- Labeled axes (y-axis & x-axis)
- Appropriate scale
- Title (appropriate for the graph; think of the units for the y-axis & x-axis)
- Data points
- A line of best fit (on certain occasions, this line does not have to pass through all the points)
- Slope (rise/run; y2-y2/x2-x1)
- Area
- Read the Graph

*Some of the information and pictures found for this blog was found from the following links; all credits go to these sites:
http://marinebio.org/upload/77/Iceberg.jpg
http://wiki.answers.com/Q/Why_density_if_ice_compared_to_water_in_liquid_state
http://www.aims.co.th/Pretest_GED/Maths/Maths-_5-6.gif
Subscribe to:
Comments (Atom)